General Overview
Explanation of Android Enterprise
Requirements and Installation
Requirements
General Settings
Account Overview
Account Information
Global Configuration
Privacy
Role Based Access
Apple Configuration
Android Configuration
Windows Configuration
ContentBox
LDAP Configuration
App Management
In-House App DB
App Settings
App Store Settings
Remote Control
Sim Card Management
Subscription Management
General Audit Log
Mobile Management
iOS Configuration
General
Device Log (only on device level)
Asset Management (only on device level)
Asset Management (only on device level)
Security Management
Anti Theft (only on device level)
Security Configuration
End of Life (only on device level)
Restriction Settings
BYOD
Connection Management
Web Management
App Management
Android Enterprise – Fully Managed Device Configuration
General
Device Log (only on device level)
Device Settings
Asset Management (only on device level)
Security Management
Anti Theft (only on device level)
Security Configuration
End of Life (only on device level)
Restriction Settings
Connection Management
PIM Management
App Management
Enterprise App Manager
Restrictions & Settings
Enterprise App Store
Enterprise Play Store
Kiosk Mode & Launcher
Remote Control
Content Management
Additional API
Samsung KNOX
Android Enterprise - Fully Managed Device with-Work Profile (COPE)
Android Enterprise – Container Configuration
General
Asset Management (only on device level)
Security Management
Anti Theft (only on device level)
Security Configuration
End of Life (only on device level)
Restriction Settings
Connection Management
PIM Management
App Management
Enterprise App Manager
Restrictions & Settings
Enterprise App Store
Enterprise Play Store
Content Management
Android Configuration
General
Device Log (only on device level)
Device Settings
Asset Management (only on device level)
Security Management
Anti Theft (only on device level)
Security Configuration
End of Life (only on device level)
Restriction Settings
BYOD Container
Connection Management
PIM Management
App Management
Enterprise App Manager
Restrictions & Settings
Kiosk Mode & Launcher
Remote Control
Content Management
Configuration Windows 10 PC
General
Device Log (only on device level)
Asset Management (only on device level)
Security Management
Anti Theft (only on device level)
Security Configuration
Restriction Settings
BitLocker
Certificate Management
Connection Management
PIM Management
App Management
Enterprise App Manager
MacOS Configuration
General
Asset Management (only on device level)
Update Management (only on device level)
Security Management
Anti Theft
Security Configuration
Restriction Settings
Connection Management
PIM Management
Dashboard & Reporting
Multitenant Management
Additional views
Dashboard View
This shows the Data and Graphs of the selected Dashboard and also lets you change these.
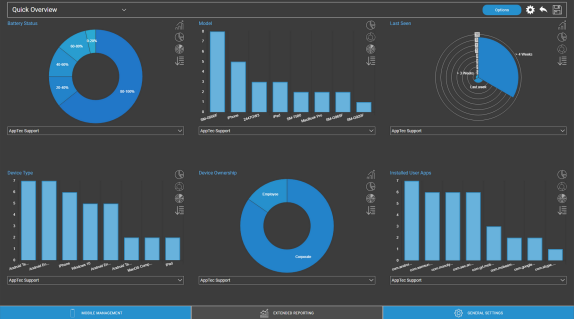
Dashboard Control
Lets you define which data is shown in the Dashboard, the amount of data to show and in which size to show these data |
|
Brings you back to the Dashboard Overview |
|
Resets the currently opened Dashboard to its default |
|
Saves all the changes you made to the currently opened Dashboard (e.g. which data to show) |
|
Change chart type to pillar chart |
|
Change chart type to pie chart |
|
Change chart type to doughnut chart |
|
Change chart type to polar area chart |
|
Change sorting order |