General Overview
Explanation of Android Enterprise
Requirements and Installation
Requirements
General Settings
Account Overview
Account Information
Global Configuration
Privacy
Role Based Access
Apple Configuration
Android Configuration
Windows Configuration
ContentBox
LDAP Configuration
App Management
In-House App DB
App Settings
App Store Settings
Remote Control
Sim Card Management
Subscription Management
General Audit Log
Mobile Management
iOS Configuration
General
Device Log (only on device level)
Asset Management (only on device level)
Asset Management (only on device level)
Security Management
Anti Theft (only on device level)
Security Configuration
End of Life (only on device level)
Restriction Settings
BYOD
Connection Management
Web Management
App Management
Android Enterprise – Fully Managed Device Configuration
General
Device Log (only on device level)
Device Settings
Asset Management (only on device level)
Security Management
Anti Theft (only on device level)
Security Configuration
End of Life (only on device level)
Restriction Settings
Connection Management
PIM Management
App Management
Enterprise App Manager
Restrictions & Settings
Enterprise App Store
Enterprise Play Store
Kiosk Mode & Launcher
Remote Control
Content Management
Additional API
Samsung KNOX
Android Enterprise - Fully Managed Device with-Work Profile (COPE)
Android Enterprise – Container Configuration
General
Asset Management (only on device level)
Security Management
Anti Theft (only on device level)
Security Configuration
End of Life (only on device level)
Restriction Settings
Connection Management
PIM Management
App Management
Enterprise App Manager
Restrictions & Settings
Enterprise App Store
Enterprise Play Store
Content Management
Android Configuration
General
Device Log (only on device level)
Device Settings
Asset Management (only on device level)
Security Management
Anti Theft (only on device level)
Security Configuration
End of Life (only on device level)
Restriction Settings
BYOD Container
Connection Management
PIM Management
App Management
Enterprise App Manager
Restrictions & Settings
Kiosk Mode & Launcher
Remote Control
Content Management
Configuration Windows 10 PC
General
Device Log (only on device level)
Asset Management (only on device level)
Security Management
Anti Theft (only on device level)
Security Configuration
Restriction Settings
BitLocker
Certificate Management
Connection Management
PIM Management
App Management
Enterprise App Manager
MacOS Configuration
General
Asset Management (only on device level)
Update Management (only on device level)
Security Management
Anti Theft
Security Configuration
Restriction Settings
Connection Management
PIM Management
Dashboard & Reporting
Multitenant Management
Additional views
Extended Reporting
The “Extended Reporting“ offers detailed overviews and graphs about device and user information.
There are a few default Reports but all of them can be manually changed to add or remove data to show.
Please note that you can only manually change which data is shown. The selected report category defines the data this is based on. E.g. you will never be able to see Android devices in the iOS report in Device Reports All Devices iOS
On the top left you can limit the data of the reporting to a certain group (and all its sub groups). By default this is set to your root node, so it takes ALL devices and users into account.
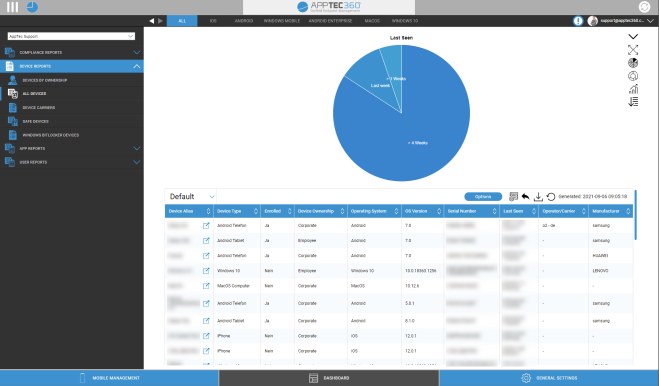
Extended Reporting Control
In each overview you can use the following functions to change the report in any way you want:
Hide chart (If chart is shown) |
|
Show chart (If chart is hidden) |
|
Expand chart (If chart is collapsed) |
|
Collapse chart (If chart is expanded) |
|
Change chart type to pillar chart |
|
Change chart type to pie chart |
|
Change chart type to doughnut chart |
|
Change chart type to polar area chart |
|
Change sorting order |
|
Modify the following parts about the displayed overview:
|
|
Open the setup manager to save and load different reports |
|
Resets the currently opened Report to default |
|
Export the current report as a .csv file |
|
Regenerate data and reload the current report |
You can find a list of all default reports on the next pages.